

This is the third in my series summarising the season to aid selection of the Player of the Year. This final analysis considers Goal Threat.
I have analysed defensive performances here – Celtic POTY: Defending.
And Creativity can be assessed here - Celtic POTY: Creativity.
Goals!
Record singing and 21-year-old Frenchman Edouard leads the goal chart with 19 plus 1 penalty. Forrest has 17, Sinclair 13 (plus 4 penalties) and Christie complete those in double figures with 10 goals and 1 penalty.
As explained many times this doesn’t always explain whether you got the rewards for the shots taken on and Expected Goals (xG) can help us here.
In terms of overall xNPG (Expected Non-Penalty Goals), the totals for the season are:
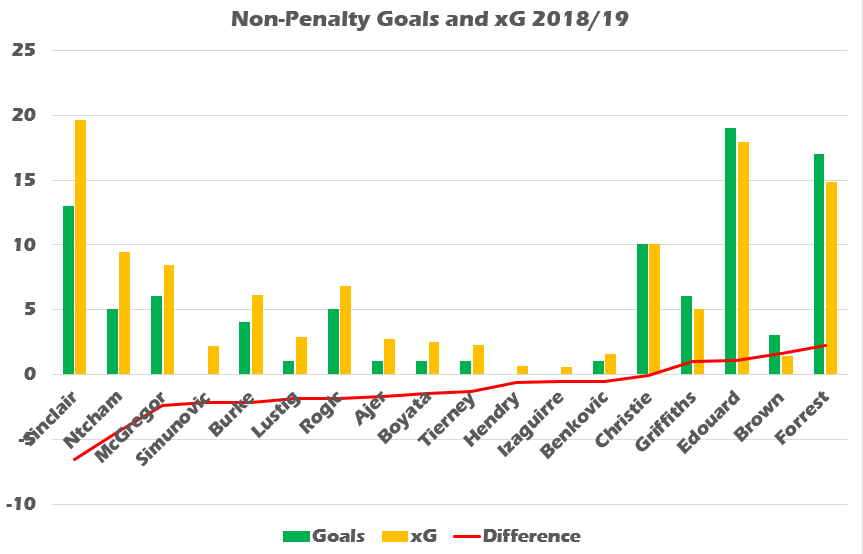
The red line indicates the extent to which each player scored over or under their expected goals. Sinclair was the player who has scored -6.559 goals less than can be expected. This may be due to saves, poor execution when in good positions, unlucky bounces or many other factors. But over time you’d expect to see this regress to the mean. Sinclair in particular has the best shot selection in the squad, shooting 79% if the time from inside the box. His average xG per shot of 0.2 is the best in the squad.
Ntcham and McGregor are the other regular scorers with tallies lower than expected.
At the other end of the scale, Forrest has over performed his xG by 2.218 goals. And Edouard by 1.133. Not massive over performances and the red line shows in general Celtic have scored a lot less goals than expected over the season – the squad is around 16 goals down on expected – that would make a massive difference to results.
Shot Accuracy
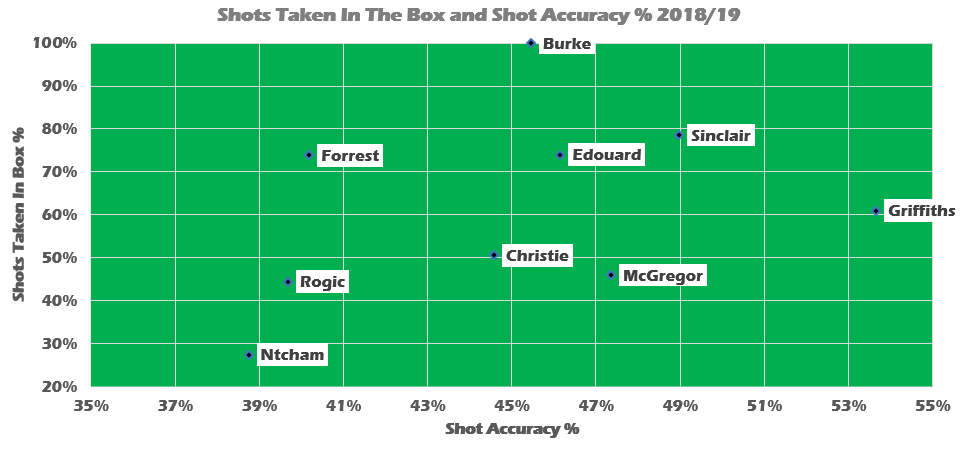
This plots Shot Accuracy (% of shots on target) with % Shots Taken in Opposition Box.
Burke’s record is remarkable in that every shot he has taken has been from inside the box (33 shots). Unfortunately, only 45% of them have been on target.
But usually shooting from inside the box would likely lead to more accurate attempts as shown by Sinclair with 79% of shots inside the box and 49% accuracy.
The value of Griffiths in breaking down defences with unexpected shots can be seen in that he only takes 61% of his shots in the box but is accurate with 54% of them – the only player over 50%.
Forrest has taken more shots from better positions this season and is on 17 goals but his shot accuracy could improve – only 40%.
Rogic and Ntcham achieve similar accuracy from generally over optimistic shots from distance. Ntcham’s shooting selection is a well-known bug bear on here!
Shot Volume and Quality
The below plots the total number of shots per 90m and the average xG of those shots.

What is interesting but perhaps not surprising is that the defensive players are on the left (low shot volume) and on average, lower shot quality. McGregor is in the middle.
On the right are the higher volume shot takers. Sinclair, as mentioned, stands out with 79% shots in the box and the best quality shots at 0.2 xG per shot. Burke and Edouard take more shots with slightly lower quality.
Griffiths has the most shots but the average quality of them is only slightly better than the optimistic Ntcham and Rogic.
Possession in Final Third
The below chart plots Possession in the Opposition Box per 90m and Possession Lost in the Final Third per 90m.
Think of it as an indicator of final third busyness!

Burke has the most possession in the opposition box despite being relatively new to the striker position. Edouard is next.
The value of Sinclair and Forrest as wide players who threaten goal cannot be underestimated. There profiles are similar to the strikers in terms of gaining possession in the box.
The different style of Griffiths is shown in that he does not get into the box with the ball as often but also loses possession more mainly due to taking a lot of corners.
As an aside (or an offside), Sinclair (0.85 per 90m) and Griffiths (0.7 per 90m) lead the pack by a distance in offsides!
Christie has been successful of the midfielders of breaking into the box, something we could see more of from Rogic, Ntcham and McGregor.
The more central midfielders have similar patterns to the full backs in Celtic’s system.
Goal Importance
Can we measure goal importance? Of course! The time a goal is scored and the game score at the time tells us what the Expected Points are that were added by that goal. A 90th minute winner will have a much higher xPts than the 5th goal in a 5-0 win, for example.
Here are the average xPts added by goals per 90m.

This season we have not seen much of Griffiths but he has scored big goals. On average his goals add 0.41 points each. Early season late winners versus Rosenborg and St Johnstone will have boosted this as well as scoring the first goal versus Suduva and Partick Thistle. But Griffiths only has 6 goals this season.
Probably more impressive however is Edouard just behind on 0.4. He is the top scorer with 19 non penalty goals and he is maintaining a high xPts across all those goals. For one so young, he is taking the mantle back from Dembele as the big game player.
The rest are significantly behind those two strikers with Sinclair again faring well on 0.25 xPts per 90m.
Of the regular scorers, McGregor’s contribute the least with only 0.06 xPts per 90m.
Summary
The young Frenchman Edouard should not be underestimated in terms of delivering the volume of goals given the pressure of the price tag and his youth. Not only that, he scores important goals.
Celtic have been well served in wide areas thanks to Forrest and Sinclair. Forrest in particular has had a prolific season and has made the most of exceeding his xG. Sinclair’s performances are for Lennon to ponder as Celtic struggle in that department lately. Burke also shows excellent striking potential.
And for Christie, it is what might have been.