

Football Variance - Leprechauns, Monsters and Speedboats
FREE TO ALL - An introduction to the vagaries of SPFL football and the differences between performances and outcomes.
This week’s edition of the Speedboat League is free to all. The reason being I have further expanded the Bully universe and hope you may all be engaged with it. The expansion pack upgrade is in the spirit of eating my own dog food.
That rather coarse phrase is one we used to use at work, and it essentially translates as do unto others as you would do to yourself. Or, if you are going to bang on in the podcasts about “variance”, “controllables”, “uncontrollables”, “luck” etc, be prepared to back up those observations empirically!
We all love football and much of that love stems from the unpredictability of it. It is a low scoring invasion game. Goals, or even near goals, are thrilling. The thrills generated from defending your own castle (the goal) or breaching the enemy’s, are visceral.
Also, the constant motion and dynamic movement mean there is always so much going on to grab the attention. It also makes it more difficult to analyse, and that leaves room for significant debate.
All those factors lead to a reality that the “better” team wins much less often that in most sports. American sports artificially level the playing field with off field controls around finances and recruitment. All those sports, plus e.g. rugby and cricket, would be dire if a lopsided talent match up occurred. With football, a severely over matched team can still put up a decent fight.
The low scoring nature means there is significant room for variance factors to influence.
Additionally, as humans, we virtually all suffer from degrees of outcome bias. That is, our sentiment and attitudes are framed by the result as opposed to the performances. The “it’s the only stat that matters” (i.e. the score) brigade being one tail of the distribution.
Here at Huddle Breakdown towers, we are probably the other end of that spectrum!
Which brings us to the Speedboat League series.
Knowing how the current season is playing out as regards these views, I’ll start with what last season looked like so that a full campaign can be used as a reference point.
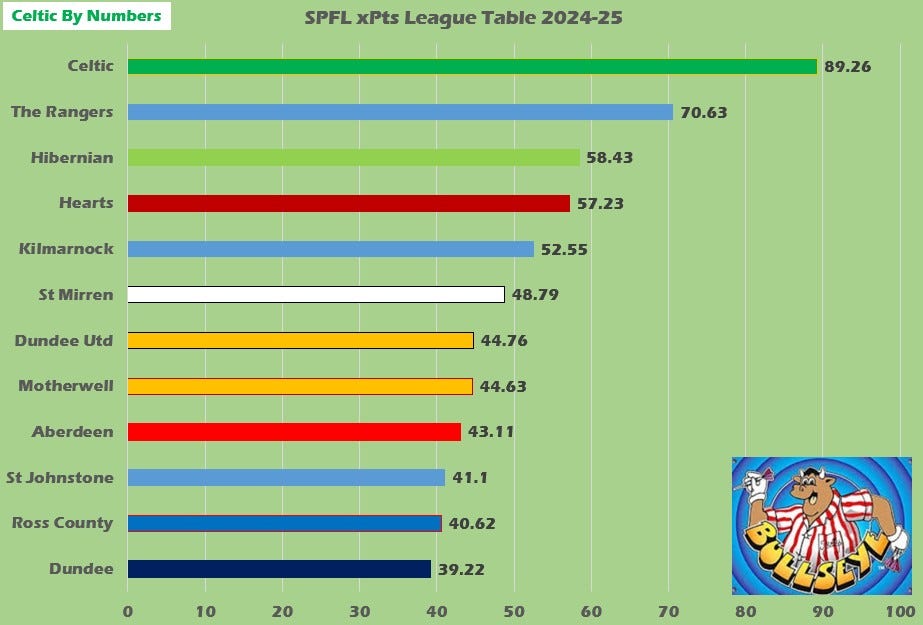
Speedboat League 2024/25
This was the final expected points table last season.
And here is a summary of variance with what happened.
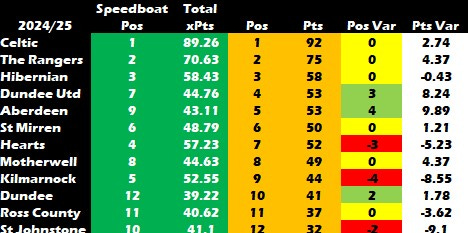
The main victims of variance were St Johnstone, who finished with over nine points less than expected. Dundee were the fortunate beneficiaries, something their board must have recognised as they sacked manager Tony Docherty at the end of the season regardless.
Aberdeen and Dundee United were the main overperformers, with the Dons being flagged from an early point in the season whereby their opening unbeaten run could not be supported by the underlying numbers.
Finally, note that the other two major differences can be found at Heart of Midlothian, under Neil Critchley and Kilmarnock, under one Derek McInnes.
We’ll develop that narrative further.
Now to introduce the two new toys in the Bully box.
Lucky Leprechaun League 2024/25 (xG)
Yep, this will offend someone or other!
Most importantly, what is it?
The LLL table attempts to show the per 90-minute impact of the following:
1. What your teams’ finishing adds to xG for;
2. What your opponents’ finishing adds to xG against;
3. What your goalkeeper adds/subtracts from xG against; and
4. What your opponents’ goalkeepers adds/subtracts from xG for.
The value is the sum of the over or under performance relative to expected goals, of actual goals scored and conceded, per 90 minutes.
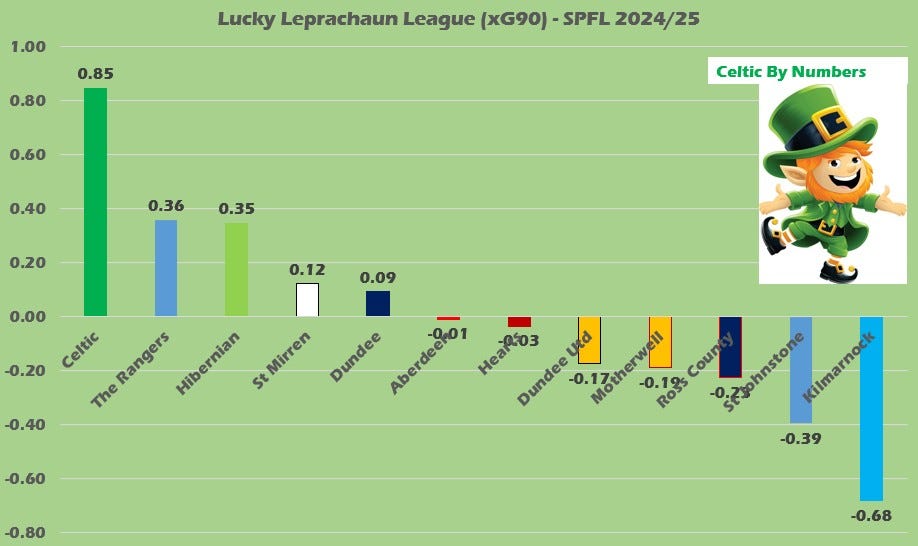
Last season, Celtic benefitted from finishing and goalkeeping variances to the tune of 0.85 xG per game. That’s some nice fortunate variance right there – equivalent to 32.3 more goals scored / less goals conceded or some mix of the two, over the season.
The top three in the standings matched those with most positive variance by these metrics.
At the bottom of the luck pile, dear old McInnes’s Kilmarnock suffered to the tune of 0.68 less goals scored or more goals conceded, than expected, per game. As we will see, don’t shed too many tears yet.
Other than the aforementioned St Johnstone, very unfortunate under the progressive leadership of Simone Valakari, most other teams were within a reasonably narrow band.
Our next attempt to quantify variance comes in the form of (more cheese ahoy):
The Variance Monster League 2025/25 (xPts)
The VML changes currency from xG to expected points (xPts).
The principle here is that football throws up some unexpected events you cannot plan for (cough, unless your name is James Tavernier, of course, cough, cough).
Penalties (massively disproportionate reward relative to the “crime”), red cards and own goals are dramatic and unexpected aspects of football. They generally have an impact on the game, given the low scoring nature. I doubt there is a sport in the word with such an impactful potential outcome as a penalty in football.
I calculate the xPts impact of each such event. To do this you take the game state (the score) and the time of the event and calculate how it adds or subtracts from the points total each team can be expected to achieve given that state.
This is a total for the season adding the benefit received from penalties awarded, own goals gifted, and red cards to the opponents, and subtracting the expected impact of penalties conceded, own goals scored and red cards received.
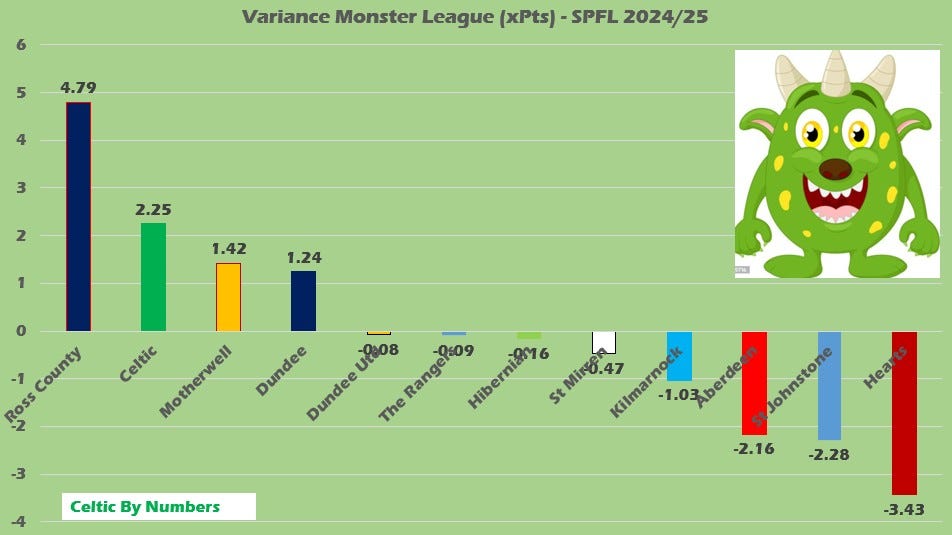
Over the season, the team benefitting the most from the volume and timing of such events was Ross County. They, net, received nearly five points more than expected due to these unforeseen events. They finished five points above St Johnstone, who managed an estimated -2.28 points less than expected. So, you can see how impactful the distribution of such events can be, albeit the Staggies lost in the play offs in any case.
Note how Hearts were the most hindered by being on the wrong side of the vagaries of football. Poor Critchley could not catch a break.
The Champions also benefitted by 2.25 expected points from footballs slings and arrows.
This hopefully sets the scene for what constitutes measurable variance, and the impact of it over a season.
Now, finally, lets reveal the current state of play in the SPFL this season.
Speedboat League 2025/26
A slight twist here is that since not all teams have played the same number of matches, I am showing the average number of expected points per game instead of the total.
The expected points are calculated from underlying performance metrics such that each game there is a percentage allocation for a home win, draw, away win, and this is reflected in the points expected to have been won.
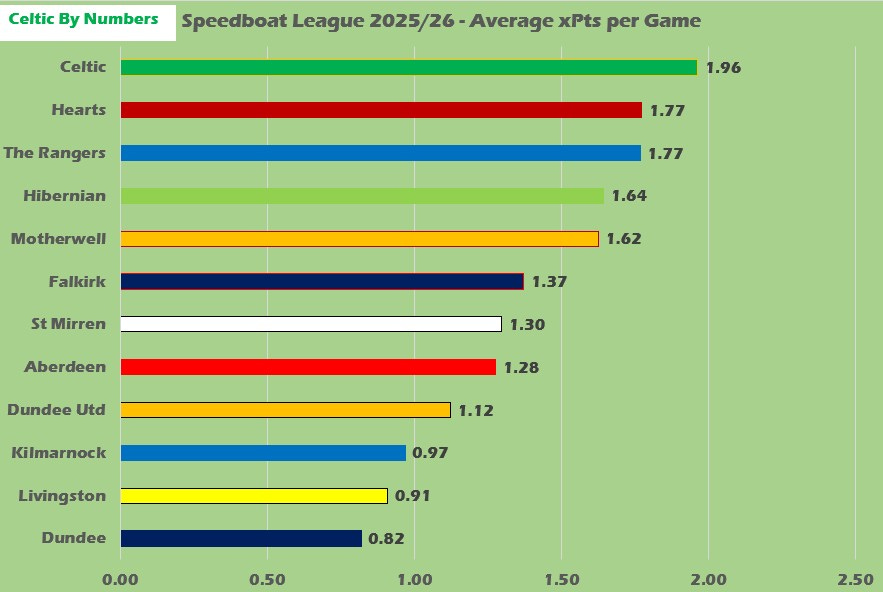
The expected points table matches the actual table quite well other than the two most important positions. Both the league leaders and the team at the bottom are flipped.
Celtic’s underlying numbers SHOULD have led to a quite comfortable lead by this stage. But of course, it hasn’t and we will dive into that in a bit.
Once again Dundee is managing to extricate themselves from what performance levels suggest should be firm relegation form, to be higher in the table.
But that is all “what you could have won”, so let’s take what reality was served up and add back underlying performance to try and do the impossible and predict the future.
The Banked It League 2025/26
This view builds out from what points have been achieved, then projects forward using expected points based on underlying performance.
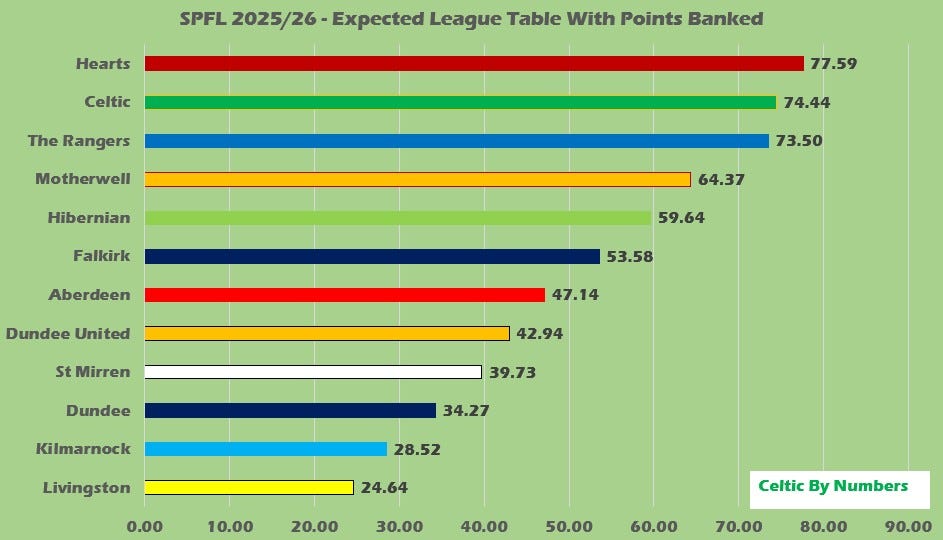
Following the draw at the weekend, Hearts have increased their expected lead over Celtic and are now over three points ahead by final projections. Given there were no discrepancies more than nine points last season, that is already looking like a promising position for the Jambos.
The Rangers continue to quietly overperform their underlying performance, but as yet, not quite enough to suggest they will take second place, but it is tight.
Admirable Motherwell are not expected to have enough to challenge the top three.
At the bottom, Livingston are adrift, more than one win away on an xPts basis.
Overall, the top and bottom sixes look locked in, ten games out from the split.
Now let’s dig into that ol’ variance.
The Lucky Leprechaun League 2025/26 (xG)
Remember, this is measuring the gap between expected and actual finishing at both ends and expected and actual goalkeeper play at both ends. The values are expressed as positive or negative xG per 90 minutes as a result.
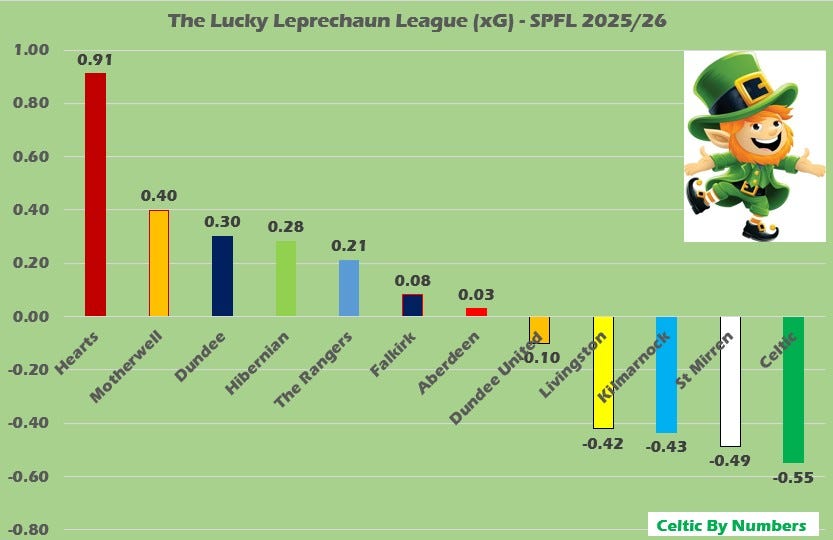
Celtic’s underlying positive variance put a shine on Brendan Rodgers’s campaign last season by a factor of 0.85 xG per game.
But McInnes’s Hearts are skying the park on that one. By nearly 1 whole xG per game in their favour. Add in the team underperforming at both ends to the greatest degree is Celtic, by -0.55 xG per game, that is 1.5 xG per game in Hearts favour from finishing and keeper play.
That is an enormous advantage from largely variable factors. We must accept that Celtic are contributing to this by steadfastly refusing to upgrade the quality of their attack, whilst also persisting with a clearly declining Kasper Schmeichel in goal.
Hearts’s over performance is less explainable as they have rotated goalkeepers, and whilst Lawrence Shankland and Claudio Braga are undoubtedly hot in finishing, have relied on low xG set pieces for goals otherwise.
As we saw with Celtic last season, such trends could persist the whole season.
Notable that Motherwell’s sweet passing football has been enhanced with positive variance at both ends of the pitch.
Dundee, of the bottom six, are the most blessed which explains the gap between them and Livingston at tail of the table.
Time to monster munch!
The Monster Variance League 2025/26 (xPts)
This nets out the positive and negative impacts per team over the season so far of penalties, red cards and own goals.
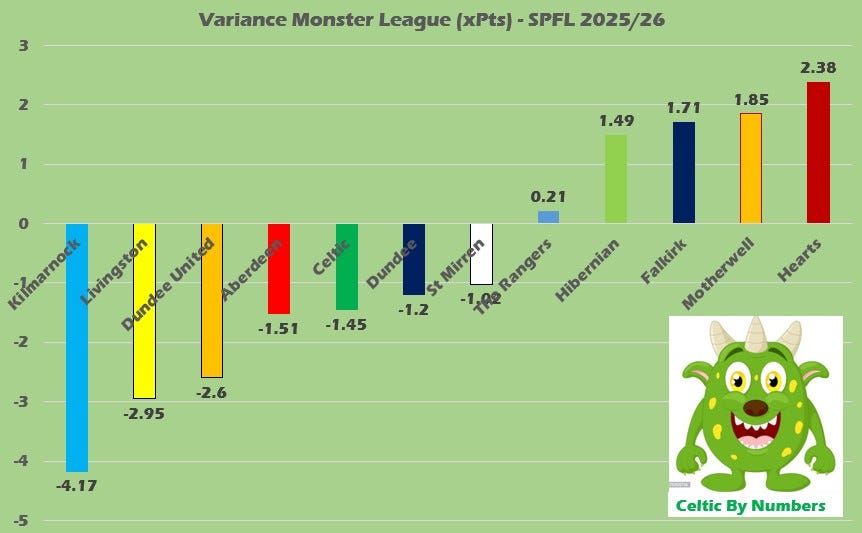
Also bear in mind this is in addition to the variances described above in the LLL. That is, there is no double counting.
So, as well as benefitting from nearly 1 xG per game and 1.5 xG over their rivals per game, Hearts have so far benefitted by 2.38 expected points from the cumulative impact of penalties, own goals and red cards.
This really is a “Leicester City” moment for them.
Can that be maintained? Does their deliberate chaos ball style actually lead to such outcomes?
I draw you back to last season and how McInnes’s Kilmarnock experienced the opposite effect. Which kind of answers the question. Chaos ball has no master when it comes to unexpected outcomes. Ride that wave, baby!
Additionally, as James has pointed out, McInnes’s Hearts underlying open play xG performance is no better or worse than Critchley’s last season, but without the variance positivity.
Again, Motherwell are benefitting from the outcomes of football’s big moments. Should their fortune turn, does their underlying performance have the resilience to avoid a mini slump?
As for Celtic, they are on the wrong side of outcomes this season, in addition to the issues of finishing and keeper play above. Recruitment in January would be crucial you’d think, albeit the variance Gods care little.
Summary
Subscribers will be familiar with most of this, and regular listeners to the podcasts will know how much we discuss variance as a key facet of football.
For newbies, I hope this puts some numerical meat on the bones of those frameworks.
I will be updating these views after each game week so please subscribe to be kept up to date with the differences between outcomes and performances when viewed through the lens of the big green eyed variance monster.
Excellent as always Alan. We are in the lap of the Gods. Still believe the Hearts bubble will burst, nothing to suggest they can handle the heat post split. We shall see. At least we have the World Cup to distract us from whatever outcome awaits.