

Craig Fowler of ‘The Scotsman’ wrote an entertaining article on the 17 most improved footballers in Scotland this season. Our own Stuart Armstrong was at number one and you can read why here (The Renaissance Man?). At number two was the five (point ninety-nine!) in a row captain Scott Brown. Craig describes Brown’s efforts thus “he was poor in 2015-16. Approaching his 31st birthday, with injury issues interrupting recent seasons, he looked finished at the highest level.”. I thought that might be a wee bit harsh. To analyse such statements is one of the primary drivers behind Celtic By Numbers. Football supporters tend to view player performance through a binary lens - a player’s performance being either “fantastic” or “rubbish” (it’s a family site!). By analysing the facts, I aim to provide an evidence based review of both team and player performances.

Brown did indeed have an injury hit season in 15/16, with knee, hamstring, and thigh injuries. Such an injury profile is a worrying echo of the pattern seen in Commons and Mulgrew as they progressed into their 30s. Leg muscle injuries are the bane of a footballer’s life and as age increases so seemingly does the propensity to be impacted by them. Brown missed 20 matches to injury last season but the season before that was not the case (the first ten matches missed), nor this (zero missed). Note that in 13/14 season Brown missed 0 games injured, and missed 9 in 12/13 due to a toe injury.
Brown is now 31, soon 32 (in June), so this analysis covers him since his 29th birthday.
(NB - Remember I have nearly three seasons on Celtic team and performance data so analysis will be limited to the start of the Deila reign).
Appearance Data
Season Total Mins Games Started 90 mins Used Sub Unused Sub Not In Squad Injured Suspended 2014/15 4268 48 45 0 0 2 10 1 2015/16 3143 35 32 1 0 1 20 0 2016/17 4067 46 42 0 0 1 0 1
When Brown is available he plays, starts, and usually lasts the 90m. Under Deila he was an orthodox central midfielder in a two, usually with Bitton. Rodgers preferred one MC in a holding role (Brown) but latterly, since Rogics’ injury, Brown and Bitton have been together again. Brown will often drop into a three at the back as the middle DC play maker. Alternatively, he also drops left defensive midfield to cover the advancing Tierney.
2014/15
Defensive Data
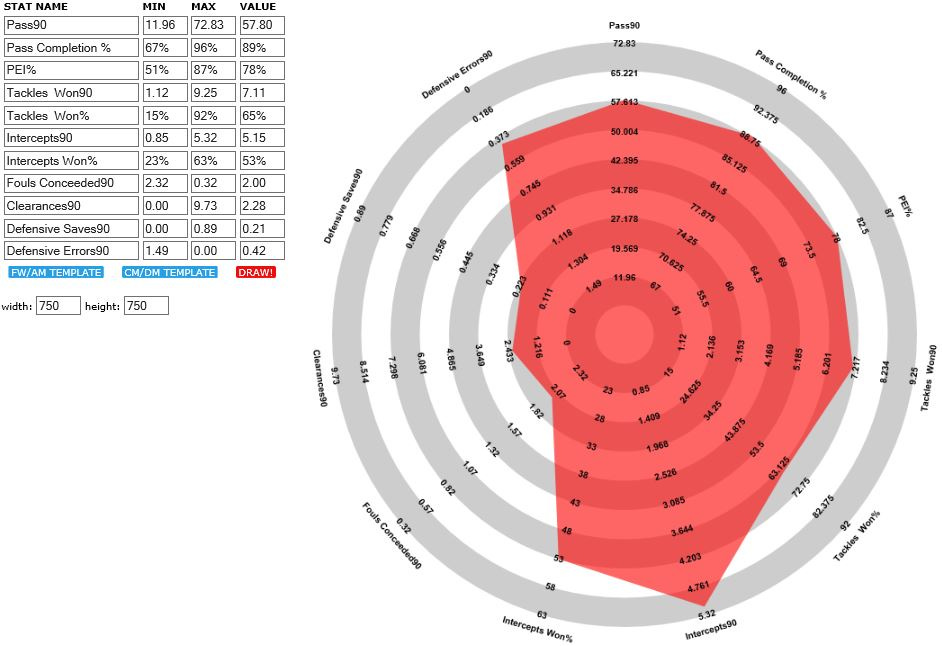
Brown’s role is primarily defensive but an ability to pass accurately is also a key requirement. Brown’s passing of 57.8 completed passes per 90m with 89% accuracy was behind Mulgrew (64.1) and Bitton (63.86) for volume of passes. He was behind Denayer (93%), Van Dijk (92%) and Bitton (90%) for pass accuracy.
His Possession Effectiveness Index (PEI) of 78% was behind only Van Dijk (81%), Bitton (81%), Denayer (80%) and Mulgrew (79%). As previously explained, PEI SHOULD be high for DCs and MCs in a defensive role as they should not be playing high risk passes. For example, Griffiths’ PEI was 56% - not because he is a “worse” player but because he takes risks and as a forward is usually being challenged when receiving the ball and is generally outnumbered when in possession. A DC or DMC should have most the match in front of them, in positions where team mates outnumber the opposition, with time and space to play relative to a forward. Hence players in those defensive positions will tend to have the higher PEIs, as passing accounts for +75% of all on field actions.
Brown, therefore, had the weaker passing and possession effectiveness of his DC and DMC colleagues. Slightly.
His 7.11 challenges won per 90m was the highest Celt after Lustig’s remarkable 9.25 per 90m, which remains the overall upper bench mark (Lustig achieved this in 1168 minutes of an injury hit season so a slight small data warning applies – equivalent to 12.97 90m matches. This just passes my 900 minute threshold for “sample sufficiency”). Overall Brown won possession 355 times that season, or 7.49 time per 90m. This was the highest by any Celt in 2014/15. He lost possession in the challenge 2.32 times per 90m, slightly higher than Bitton (2.2) and much higher than the DCs Van Dijk (0.83) and Denayer (0.73 – any chance we can have him back??). This is to be expected - the DCs should have relatively low challenge loss rates.
Brown’s intercepts won rate (53%) was slightly better than Bitton (51%) and Johansen (48%), the same as Denayer but all were behind Van Dijk on 63%
In terms of defensive saves and errors on both counts Brown out performed Bitton, his nearest peer.
It is worth noting, finally, that Brown missed all the Champions League Qualifiers through injury – unlucky both for himself, Celtic, and Deila.
Attacking Data
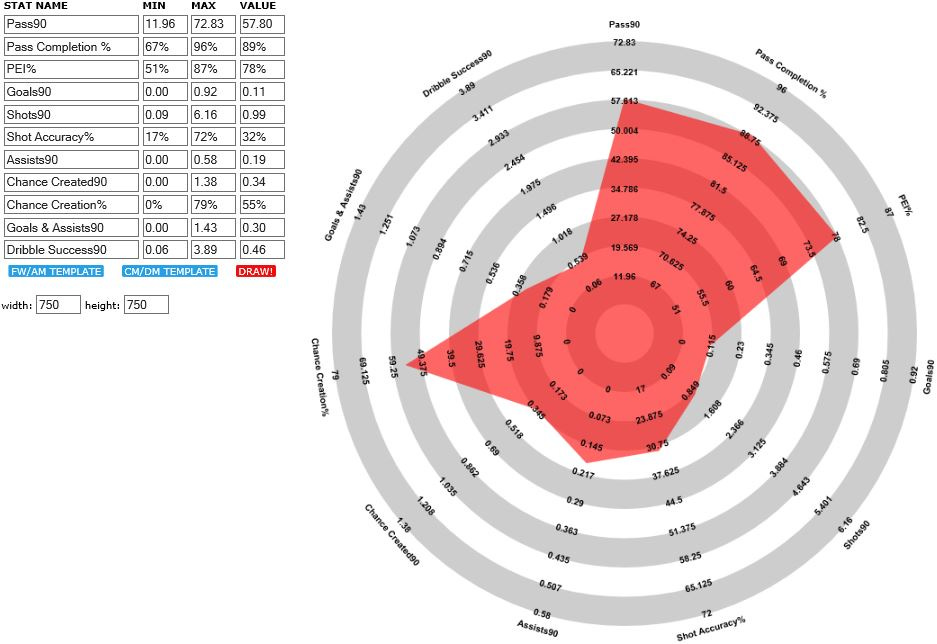
Attacking is not Brown’s core responsibility (as the sparse radar shows), having never scored more than 8 goals in a season, netting 5 in 2014/15 was relatively prolific. 9 assists were added – his joint highest ever for Celtic. Overall, Brown managed a goal or assist at the rate of 0.3 every 90m. For comparison, Bitton’s was 0.22.
He attempted 44 dribbles over the season, being successful with 22 of them. Bitton attempted 20 only.
Overall, a relatively productive season for Brown in an attacking sense.
2015/16
Defensive Data
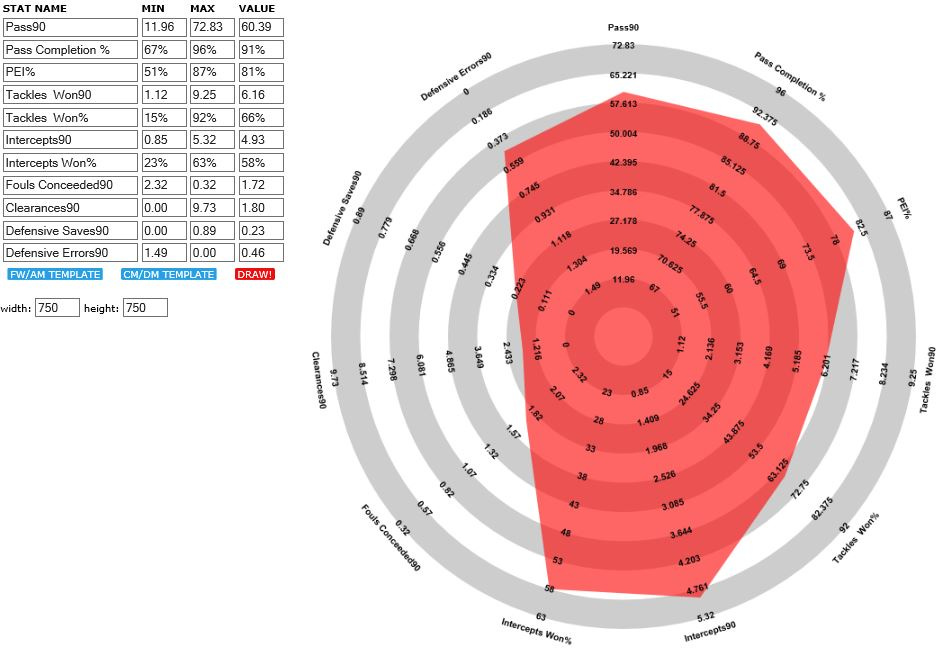
Brown missed 20 matches through injury in 2015/16 – there were short breaks at the very start and end of the season and a 15 game absence in the middle covering November through to end January. Yet despite this, and in a team clearly stagnating under Deila, Brown posted better passing stats.
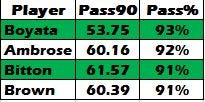
Pass volume (60.39 per 90m) and accuracy (91%) were both up on the previous season. Comparative passers:
Therefore, Brown was slightly behind his MC partner Bitton in passes per 90m and matched him for accuracy.
PEI was up 3% on 2014/15, helped by an improved passing %. In comparison to the squad, the top PEI’s were:
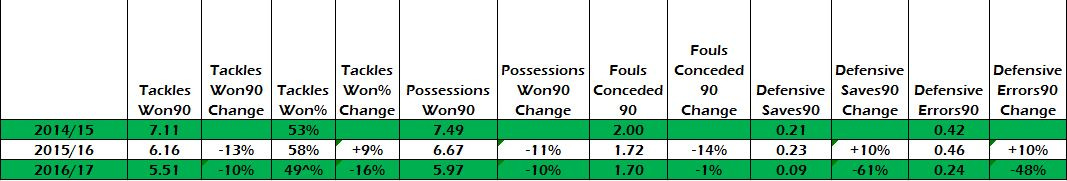
His tackle rate went down to 6.16 per 90m but tackle success increased dramatically to 66%. Overall, Brown won possession 6.67 time per 90m. Bitton managed 5.77 with a challenge success rate of 59% winning 5.96 per 90m. Brown also won slightly less intercepts but kept possession from 5% more than the previous season.
Defensive saves (0.23) and errors (0.46) were both fractions up on the previous season.
Attacking Data
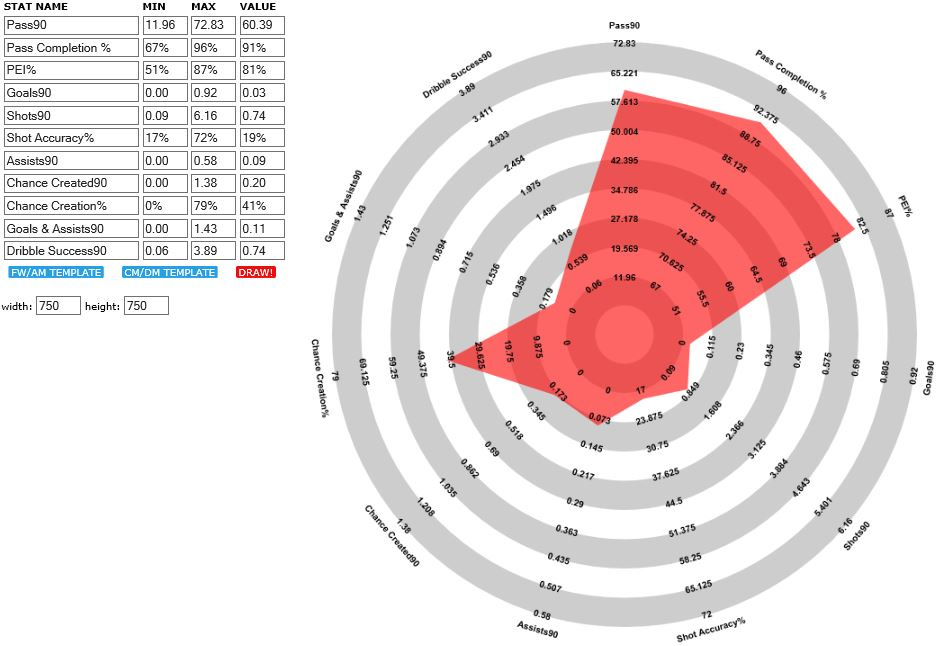
In simple terms, Brown’s attacking output reduced dramatically with 1 goal and 3 assists over the season. He managed a goal or assist at the rate of 0.11 per 90m compared to 0.3 the previous season. There were less shots and they were markedly less accurate (only 19% shots on target compared to 32% in 14/15). Brown also created less chances (0.2 per 90m compared to 0.34) and was less successful overall when attempting to create (41% compared to 55% the previous season). Outside of this trend, dribble rate increased with 0.74 per 90m, completing 26 and failing with 16.
Based on the data, there is a mixed picture. Overall Brown maintained possession better and passed more frequently and accurately, but completed less tackles, intercepts, clearances, and fouls. The quality of intercepts and tackles went up, however. His attacking outputs undoubtedly reduced significantly, albeit that is not his primary role in the team.
In response to injury, was Brown playing a more patient and conservative game? He seems to be getting involved in less dynamic actions – more circumspect, or slower?
There are regressions in performance, but little in the data to suggest he was “finished at the highest level” compared to the previous season. Unless you argue he was finished at the highest level in 14/15!
2016/17
Defensive Data
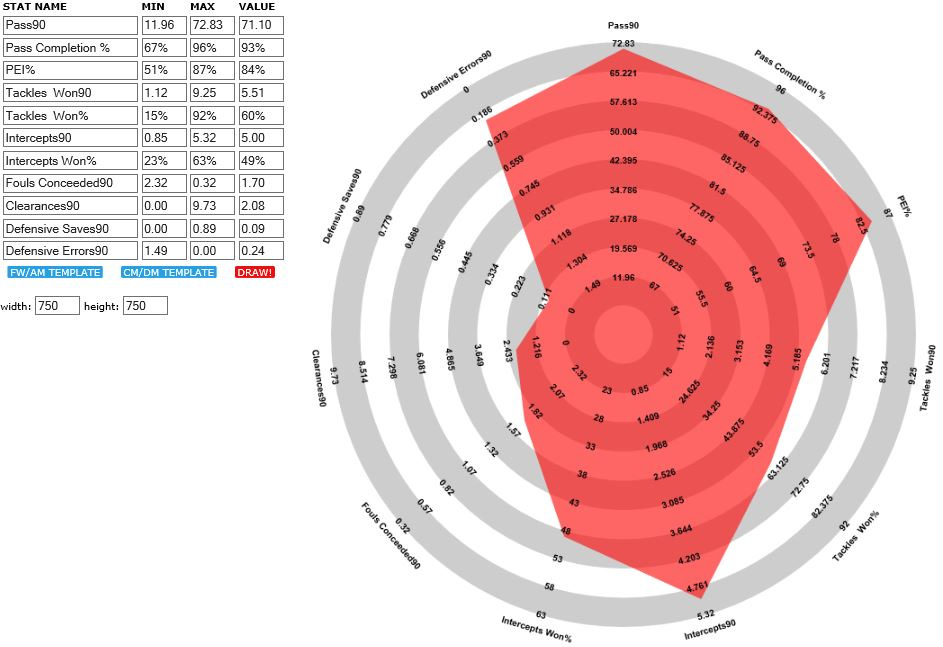
As we review the season yet to end, we are now starting to see trends. Once again Brown’s passing and possession retention are up on previous seasons. Rodgers’ team passes the ball significantly more than Deila’s and therefore most players have increased their passing output.
To see the three seasons side by side:
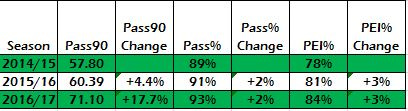
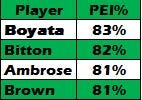
Brown is now passing 14 times per 90m more than two seasons ago, and 4% more accurately. His passing accuracy this season is behind the central defenders Boyata (a remarkable 96%), Simunovic and Sviatchenko (94% for both).
Similarly, his possession effectiveness has increased 6% over the last two seasons. At 84%, this is matched by Simunovic and bettered by Boyata at 86%.
And there are other trends. The following are all on the decline year on year – Tackles Won per 90m, Tackles Won %, Possessions Won, Fouls Conceded, Defensive Saves and Defensive Errors. His Intercept rate is flat.
Tackling, fouling, making last ditch defensive saves – all are dynamic activities – rapid decisions and action required. Is Brown better managing himself, positioning himself better and pacing himself better given age and injury record? Players talk about losing “a yard of pace”. Is Brown aware of his limitations as he enters his 30s and must manage his body? His improved passing and overall possession effectiveness allied to the decrease in dynamic defensive actions may indicate a player making more pragmatic decisions, keeping possession, keeping it simple, not wandering from team shape.
Brown appears to be adjusting his game, as trends show over the last three seasons of defensive data.
Finally let’s see if the if the current season attacking data supports that conclusion.
Attacking Data
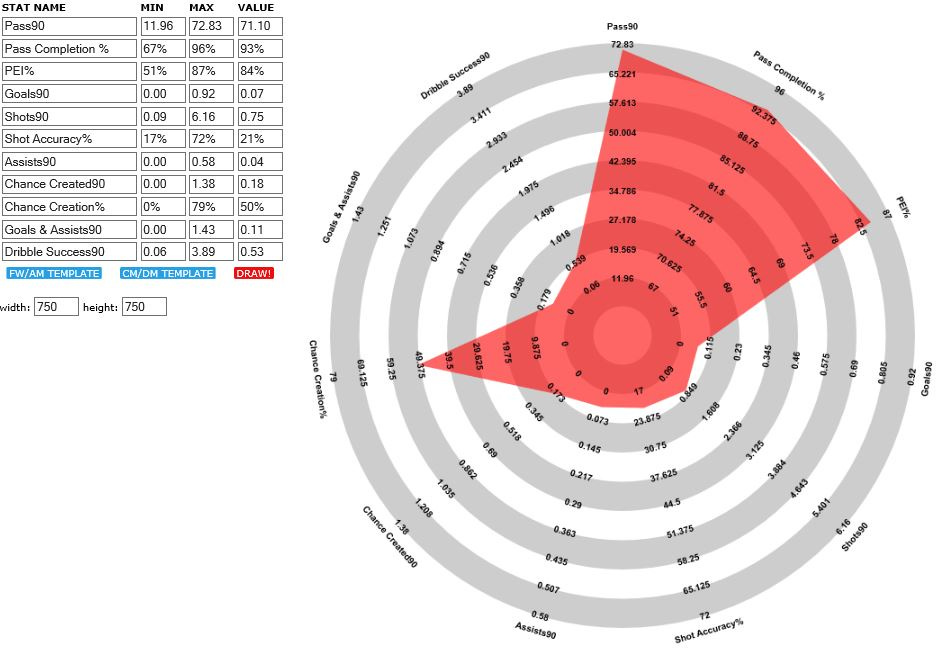
Note: I maintain the passing and PEI data for both defensive and attacking radars as they are core KPIs relevant to all players.
The trend for Brown within the attacking radar is a year on year shrinking of the red area. Although last season was injury hit and perceived to be average in terms of form, the goals per 90m, attempts and even shot accuracy are all flat this season.
Chance Creation and Assists per 90m continue to decrease year on year. Dribble success is down from 0.74 per 90m to 0.53. Overall Goals and Assists per 90m is flat at 0.11.
Brown has managed 3 goals and 2 assists this season. The goals tally is on a par with previous campaigns, but 2 assists would be his lowest tally for Celtic – he is averaging over 6 a season.
With a reduction of dribbles attempted from 1.2 per 90m to 1.08 per 90m, and a reduction in chance creation and attempts, the trend of downward involvement with (in this case) dynamic attacking activities is again evident.
Conclusion
I believe the data debunks the notion Brown was playing like a man finished at the top level in 15/16. In that season, he continued a trend evidenced this, of adjusting his game in response to recent injuries and the accumulated strain of an all-action style in the most demanding area of the team over 12 seasons. He is controlling games more with increased passing and accuracy, and maintaining possession. The captain has passed the ball over 80 times in a match on 15 occasions this season, including both home and away vs Borussia Moenchengladbach. He’s passed it over 100 times on 6 occasions. On average, he gives the ball away with 5.07 passes per 90m. Brown is not getting as involved in the physical and dynamic actions of the game and many defensive and offensive indicators show evidence of decrease season on season.
In summary, I believe the data conclusively shows Brown is adapting his game to his age and his conditioning.
Given he / the club feels the need to adapt in this way, having Brown play for Scotland and then having two weeks break before preseason training resumes in advance of another Champions League campaign, makes little sense. As I showed in Running To Stand Still, there is evidence of Brown’s performance dropping off as we get into the 10th month of Celtic’s season. Our captain needs careful management to maintain his injury free season and impressive form.