


I've taken a look at a couple of my favourite metrics, G/xG and xG/shot, to see if there's anything interesting in the data. Turns out there is.
A LOOK AT THE xG DATA FOR CELTIC'S 2024-25 SPFL CAMPAIGN
Expected goals (xG) is a great metric, but it's not always straightforward to use. On a match-by-match basis, it doesn't tell us very much beyond indicating whether Lady Luck was favouring us, or if we were in her bad books that day. If we compare the actual goals (G) scored by Celtic in our SPFL matches last season to the expected goals (xG), we see only a weak correlation. For example, an xG of about 2 produced real returns between 0 and 5 goals.
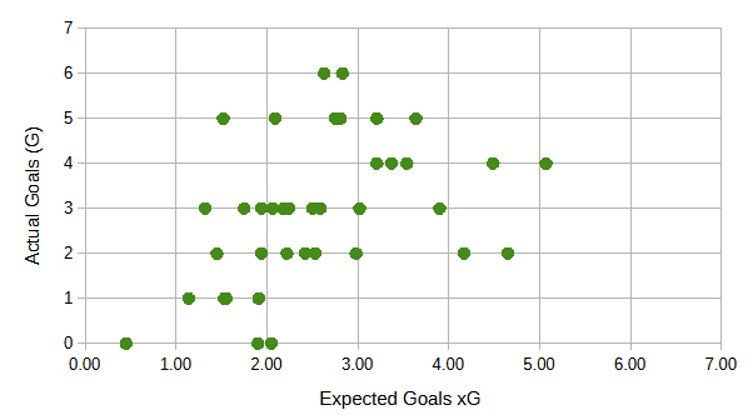
Clearly, xG is a measure that needs a bigger sample than the shots in a single match, but how many shots do we need for us to be able to extract useful information about the performances of the team and the players?
I decided to look at two of my favourite metrics. The first is the ratio of actual goals to expected goals, ie goals per expected goal, G/xG. For an average team or player, G/xG should average out to 1. That's what an xG model does: it predicts the probability of an average player scoring any chance. If a goal-scoring opportunity has an xG or 0.15, then, with a single shot, a player will either score or not score, but over 100 shots, you'd expect about 15 goals to be scored.
The reason I'm interested in G/xG is that I believe it is a good indicator of whether the (attacking) players in a team are better than, worse than, or simply just average. Good players outperform xG. I think we'd expect that. The difference between a good striker and an average striker is that the good striker is quicker to the ball and better set to strike it, allowing him to shoot harder and more accurately than a poorer player in the same position. It's worth emphasising that last point: this metric isn't about the quality of chances, it's about how well the players deal with the chances they are given.
The second metric I want to consider is the average xG per shot (xG/sh). This is very much a team metric and concerns the quality of chances created. The chance of scoring (xG) increases dramatically as you get nearer to the goal. If a team can create chances in the 6-yard box, it'll be able to convert a lot more of them than it would with shots from the edge of the penalty area. Similarly, xG is increased if an attack can create a situation where there are fewer defenders between the shooter and the goal.
Modern tactics such as Guardiola's tiki-taka and Postecoglou's Ange-ball focused on stretching defences across the pitch and trying to play the ball into areas as near the goal as possible, and with enough speed to catch out the defenders to create clearer opportunities. We've had some seasons recently where The Rangers have had a similar number, or even more, shots than Celtic throughout a season but have had much lower xG (and actual goals), but that's perhaps not surprising for a side in which so much of the burden of chance creation relied on long crosses from their overlapping fullbacks.
I'm also going to look at the other side of these two metrics: goals against per expected goal against (GA/xGA) and expected goals against per shot against (xGA/shA).
So, here's a plot of G/xG against the total number of shots taken by Celtic in the SPFL last season. (All of the data I'm using is for SPFL 2024-25.) The individual data points come from the data being collected on a per-match basis.
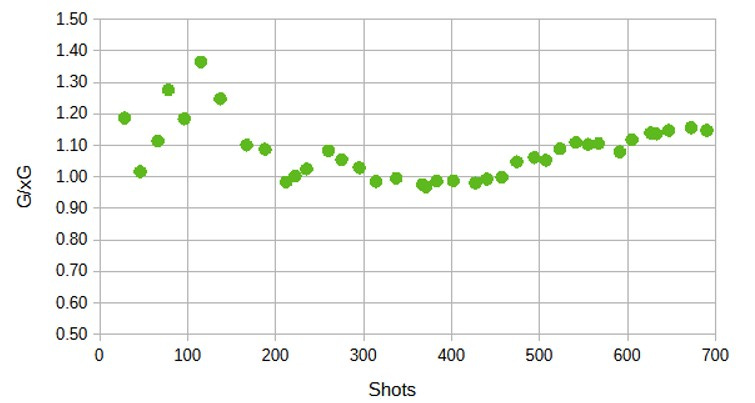
The first thing to note is that it takes about 200 shots before the metric "settles down". Celtic takes about 18 shots per match, so this fits well with Alan's 900-minute rule for robust statistical analysis.
The second important feature of the chart is that Celtic do indeed exceed their expected goals, and by quite some way - in fact, 15% above expectation (G/xG = 1.15). We can be quite confident that Celtic's players are converting their chances more efficiently than the average expectation of the model. Of course, that shouldn't come as a surprise; Celtic have some very good players by any measure.
The third notable feature of this chart is a bit trickier to interpret. Between the 200 and 400 shot marks (matches 10 to 24), the graph bumps along at about G/xG = 1, a decidedly average performance. However, from that point on, the graph climbs steadily to reach what appears to be an equilibrium at 1.15. The inflexion point at about match 25 coincides with the period when we saw the departure of Kyogo, the arrival of Jota and the shift of Daizen to striker. Cause or correlation? It's hard to tell.
Like everyone else, I have an opinion, and I think that Kyogo was out of sorts whether because of the role he was asked to play in Rodgers' team or just because he wanted to be somewhere else. I think that Daizen is not best placed on the left wing and contributes much more as a striker. I also think that Jota is Celtic's most creative player, and that his ability with both feet makes him the most dangerous winger at the club. I think that replacing Kyogo with Jota strengthened the team significantly, and I wasn't surprised to see this reflected in the numbers.
Next up is a plot of xG against total shots. There are 2 other things on the chart: actual goals and a linear regression fit to the xG data. The linear regression allows us to calculate the xG/shot and to judge how consistently the team created chances.
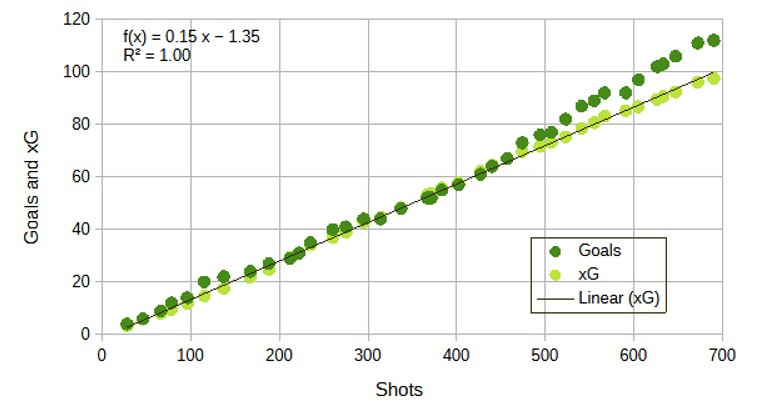
There are a few things worth noting. The first is that the rate of chance creation (xG/sh) is a straight line (R2 = 1.00) throughout the season. The team creates chances for consistent quality. The next thing to note is that the value of xG/sh is 0.15, and this is quite high by most standards, ie Celtic have, on average, been making very good chances. The third notable feature is, of course, that consistent improvement in chance conversion from match 25 onwards. The fourth thing that's noteworthy is that the quality of chances, ie xG/sh, doesn't improve after match 25; those extra goals are scored because the players are doing a much better job of taking them.
It's worth taking a brief look at the opposition statistics. Celtic faced fewer than 300 shots last season, a consequence of dominating possession in matches.
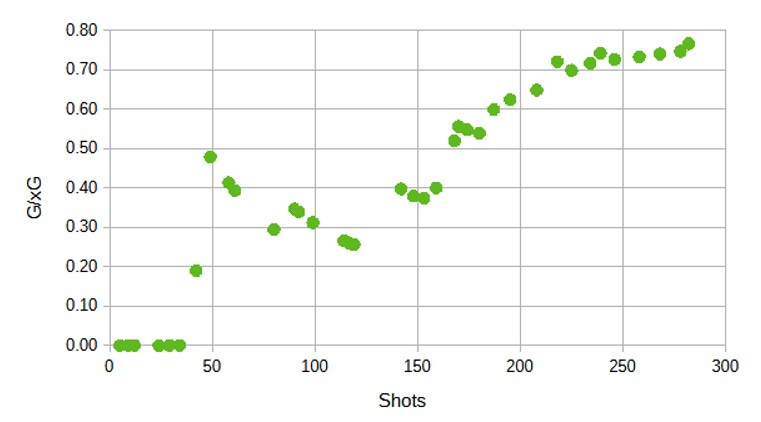
The GA/xGA plot shows that, as with Celtic, it takes about 200 shots for the metric to stabilise, ie for expected goals to be a decent estimate of actual goals. Our SPFL opponents register a rather poor goals per expected goals ratio of only 0.77. It might have been expected that this metric would come out at 1 because it's an average of all the other SPFL teams, but this just seems to be another example of the gulf between the Glasgow big two and the other teams in the division. If you and your pals were in a room with Jeff Bezos, the average wealth of everybody in the room would be a few billion dollars. We can conclude that the average player in the SPFL lags far behind that of Celtic in terms of finishing chances.
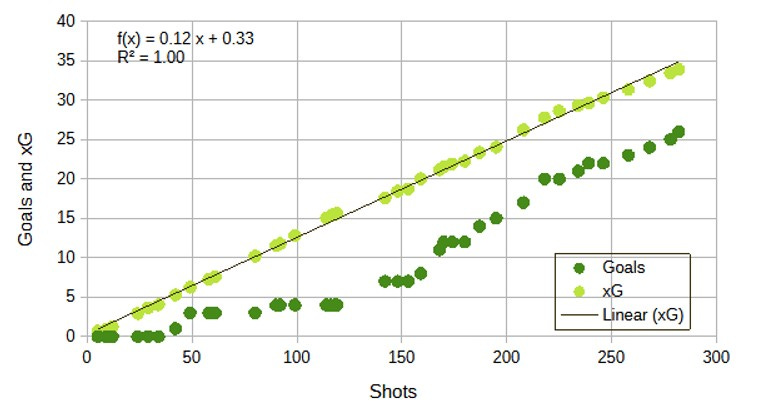
The xGA/sh and GA/sh chart shows a couple of interesting features. The first is that the quality of opportunities made by our opponents is consistent and is quite high at 0.12 xGA/sh. Perhaps that's the consequence of the high defensive line that allows Celtic to restrict the number of chances their opponents get, at the expense of those chances being pretty good on the occasions they break through. It also might be related to defending set pieces rather poorly. The second feature that's notable on this chart is that for the opening 22 games of the season, Celtic only conceded 8 goals despite an xGA of 20. It seems that that might just have been lucky because it certainly ran out for the rest of the season, during which our opponents scored at the same rate as they accumulated xG (the two plots are just about parallel, i.e. they have the same rate).
So, that was a brief exploration of my two favourite metrics, which just leaves the question: is it normal for a person to have favourite metrics? I do hope so.
Stephen McGeoch
If you would like to write a guest article, please email us.
Great post and really good to see contributions from the community on the site. If I find anything useful to say I will try and contribute in coming months.
At what level of player would xg =goals? I’m still trying to understand these data models 🥹 Am I right I’m saying a human analyst is looking at every game and makes their xg % guess on a shot taken based on their own interpretation of ‘the probability of an average player’? So is any data between 2 x games comparable?